Have you seen a MPD connection in 3D?
Check this article to see how looks like the MPD connections in 3D.
During MPD connections we replace the annular friction by applying surface back pressure to achieve the target bottom hole pressure or target ECD.
This effect “bends” the annular profile to achieve the desire bottom hole pressure.
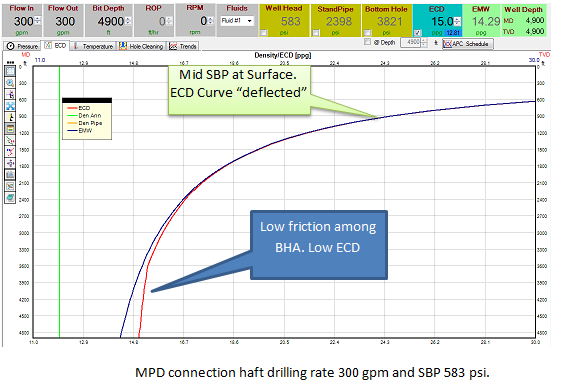
Imagine a sheet of paper and pushing one finger in the in the edge, the paper would deform according with the amount of pressure we apply, this effect is similar to the MPD connections since as we decrease the flow rate the annular friction decreases, but it does also in the annular profile gradually from the top to the bottom.
Let’s remember the friction depends on the rheology model and mud properties like viscosity among others. Meaning different rheology model will create different shape during the MPD connection schedule. This shape will be seen in the ECD profile (Check the video for more detail).
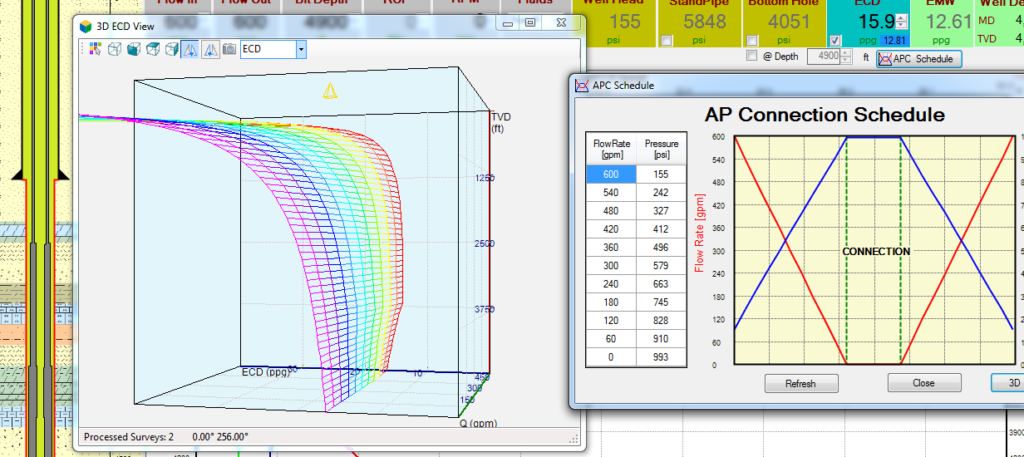
At Drillsoft we have implemented a new feature to illustrate this effect that sometimes is difficult to understand or comprehend. Below graphics show the 3 stages in the MPD connection. Blue line is the EMW and the red line shows the ECD profile. .
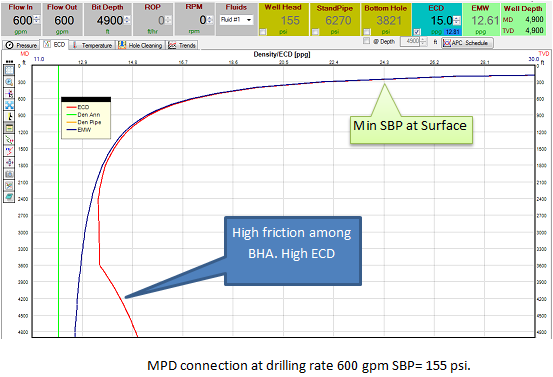
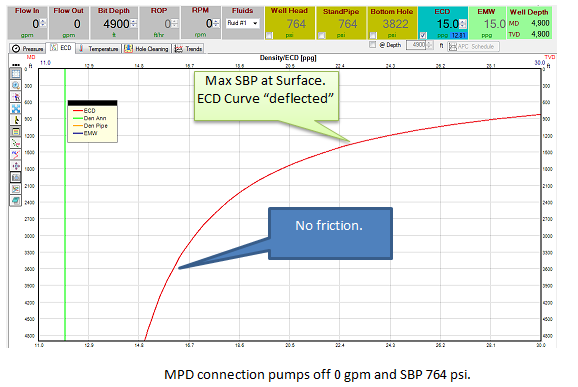
In the MPD connection you will see these profiles changing from the full flow rate to the pumps off.
Also notice how the ECD profile at the close the surface changes a lot and get “deflected” due the effect of the surface back pressure. Now you know what about to see in the following video.
The 3D view can show pressure profile or ECD profile. We choose the ECD profile since is more notorious to capture this effect.
Don’t miss out the next article, we will post the similar ECD en 3D with different well profiles (deviated, heavy pill in the annulus and much more…
If like this video or article please share with your friends.
If you have any question please comment below.
Leave a reply
Leave a reply